RTXCview System Trace
and Profiling Tool
Get new insight into the behavior of your system
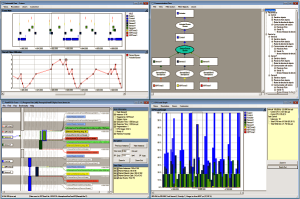
RTXCview is a system trace tool designed to work in tight integration with the RTXC Quadros RTOS family. This powerful visualization tool gives you deep visibility into system performance and behavior. Typical embedded system development tools such as debuggers can only provide a static view of your system, focusing on code-level details. RTXCview complements this view by providing a system-level view, showing how tasks and interrupts interact with the RTXC kernel.
Why use RTXCview?
- Gain a better understanding of your system’s runtime behavior which means a better, more reliable system in the field.
- Discover race conditions, deadlocks, CPU starvation, and other system-level problems
- Determine the underlying causes of system failures
- Prevent problems by studying trends in CPU usage and performance
Requires no changes to your application code. What you test is what you deliver.
Single seat licenses start at only $1500.
How Does It Work?
The RTXCview product consists of two parts: a Recorder in the RTXC kernel, which logs system and user events in target RAM, and a Viewer, which runs on a host PC.
RTXCview uses a unique visualization display to give you insight into your real-time system. You can use the visual data to look at the performance of your system over time. Zoom in or zoom out to display different levels of detail.
The unique vertical time-line makes scrolling more natural and gives a better overview than traditional Gantt-diagrams used in other tracing tools, especially when zooming out to overview a long scenario, or if the view contains many active tasks. Even when zooming out a lot, the visualization is still meaningful and you can get a good overview over long scenarios.
You can start and stop the RTXCview monitoring as needed to capture trace files for specific periods of time. The recorder uses a fixed size ring-buffer in target RAM, which always holds the most recent events. You can specify the amount of RAM you wish to dedicate for this purpose. You can record valuable information using only a few KB, although more is recommended if available.
System Requirements
RTXCview is designed for software engineers – no external hardware is required. You will need
- A host PC running Microsoft Windows (Windows XP, Windows 7 or Windows 8)
- Microsoft .NET framework, version 2.0 or later
- IAR EWARM, Keil MDK, or Atollic TrueSTUDIO development tool package with RTXC Quadros Kernel Awareness plugin
- Development target board
NOTE: You can experience a full demo version of RTXCview without the development tools or target board. The demo uses supplied trace files. https://info.quadros.com/graphical-system-trace-tool—free-evaluation-copy/
Developers Note: If you are interested in this product, we strongly encourage you to purchase RTXCview at the beginning of your project. RTXCview is tightly integrated with the RTXC Quadros kernel. If you wait to purchase RTXCview you will need to be under a current support agreement and will likely require a software update that contains the latest version of RTXC Quadros with the RTXCview instrumentation code. If you are troubleshooting a difficult problem, you may not want to introduce more variables into your environment with a software update, and wait for the preparation of RTXCView integration for your particular software distribution.
Click on image for larger view
When developing embedded software a traditional debugger is often insufficient to fully understand the software’s run-time behavior. To study real-time operating system behavior, such as scheduling, blocking and interactions between tasks you need an entirely new view. RTXCview provides a system-level view, showing how tasks and interrupts interact with the RTXC kernel, including timing.

